
Noise flooding explained
Noise Flooding your metadata for privacy is a technique of artificially creating believable metadata so that real traffic is lost. Every day your device leaves a trail of tiny data points — URLs you visit, timestamps, user-agent strings, and IP addresses. To a data-broker or advertising network those points are the signal that lets them build a high-confidence profile of who you are, what you buy, and even what you might vote for. By deliberately injecting a modest amount of harmless, random traffic — what we call noise — you can tip the balance so that the observable signal-to-noise ratio (SNR) drops dramatically, making the collected data statistically useless.
Think of it like trying to listen to a whispered conversation in a crowded café. The louder the surrounding chatter, the harder it is for anyone to isolate the words you care about. In the digital realm, the “café” is the global flow of HTTP requests that passes through your ISP and the services you touch. By routing all of your normal traffic through a local proxy, counting how much of that traffic is truly identifying, and then adding a calibrated stream of benign requests (simple GETs to public sites, DNS look-ups, or lightweight IoT telemetry), you can measure your baseline SNR, introduce controlled noise, and watch the ratio fall below the 0.2 threshold that most profiling engines consider reliable. The result is a privacy-friendly “static” that lets you browse freely while keeping your personal signal hidden in the noise. You literally are the needle in the haystack of digital traffic.
A Holistic, Multi-Device Noise Strategy
The example and analogy that I mentioned above is valid, but it is just one device. Your home has many devices that are internet connected: Laptop, computer, smartphones, tablets, smart TVs, voice assistants, thermostats, security cameras, even a Wi-Fi enabled printer. If you only flood one device, the rest of the ecosystem still hands a clean, high-quality signal to collectors, and the overall SNR stays relatively high. The most effective way is to make a system-wide orchestra of believable background traffic. I wrote briefly about this in the Thanksgiving article, but the coding is more sophisticated and therefore more believable to anyone collecting the data with this iteration.
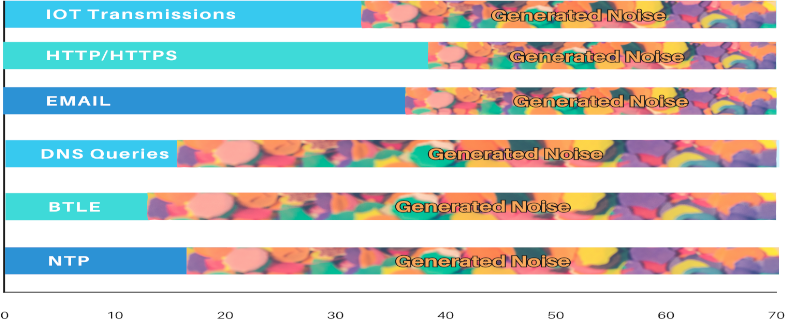
We have to make the traffic believable:
Smartphones:
- Expected traffic:
- Web: HTTP/HTTPS (port 80/443)
- Email: (POP3 – Port 110, SMTP – Port 25)
- DNS: (Port 53)
- Network Time Protocol: (NTP – Port 123)
- Cell Tower Ping
- BTLE (Bluetooth Low Energy beacons)
Laptop/Desktop:
- Expected traffic:
- Web: HTTP/HTTPS (port 80/443)
- Email: (POP3 – Port 110, SMTP – Port 25)
- DNS: (Port 53)
- Network Time Protocol: (NTP – Port 123)
IoT sensors:
- Expected traffic:
- MQTT (Message Queuing Telemetry Transport)
Other Factors that play into making the “Noise” believable
- User-Agent rotation — mimic the variety of browsers and OS versions each device would naturally use.
- Geographic diversity — if you already run a VPN or Tor on the device, let the noise follow the same exit node; otherwise, use a residential VPN that rotates IPs.
- Timing jitter — random intervals (30 s-90 s for phones, 5-15 min for laptops, 30-60 min for TVs) prevent a perfectly periodic pattern that a classifier could filter out. Humans are not precise or predictable and that is who we are mimicking.
Setting the “Baseline”
The first thing to know is “how much digital noise am I making?”. To find this out we have to measure. To do this we are going to use a transparent proxy placed on your home router (or a Raspberry Pi acting as a gateway). I let mine run for a whole day and then divided it hour by hour to see what the result was. Once you have that you can convert it into a JSON file:
mitmdump -nr house_traffic.mitm -w

house_traffic.json
The we start up the Noise Orchestra and measure that. When you compare the two you should get a significant drop in the “Real Data” vs the “Fabricated Noise”. A drop from, say, 0.42 → 0.09 demonstrates that the collective noise from every device has pushed the signal below the 0.2 (2%) threshold most profiling engines consider reliable. If it isn’t you can increase the noise, do this a little at a time.
The code that I am running on my Linux work station and a Raspberry PI 5 are included in a noise-orchestra Script Zip File – The code is heavily commented so you can follow along. You can run this on Linux or MAC (some code may need a bit of tweaking) or on Windows under the Linux subsystem. I have only run this on Linux. If you have problems or questions use the comments and I will try to help out.
Putting It All Together
Your digital footprint isn’t just the phone in your pocket — it’s the sum of every request made by every device in your home. By treating each endpoint as a tiny radio transmitter and flooding the airwaves with believable, low-value traffic, you can lower the overall signal-to-noise ratio below the point where advertisers, data brokers, or even government analysts can extract a reliable profile. The result? A household that looks busy, but whose real activities remain hidden in the static.

I encourage you to try the code and see for yourself how well it works. Sign up for the newsletter to keep informed. This is the Tactical part of the project, in a couple weeks the Strategic part will go into refinements and other tactics and strategies to enhance the effectiveness of the overall effect. Download the Instructions and the article (PDF). If you have questions or comments, please write them below. The first five people that comment and give me a JSON file (You can redact it so it is generic) – will get a social sharing badge they can use on any platform, showing they are DATA DUST Pioneers.
 Disclaimer:
This article is for individuals at higher risk or in places that have repressive governments. It is intended to augment freedoms that we all hold dear. I do not advocate anything illegal or immoral be done with this knowledge. Be safe out there.